Monitor Data Points
Access Monitor Data Points
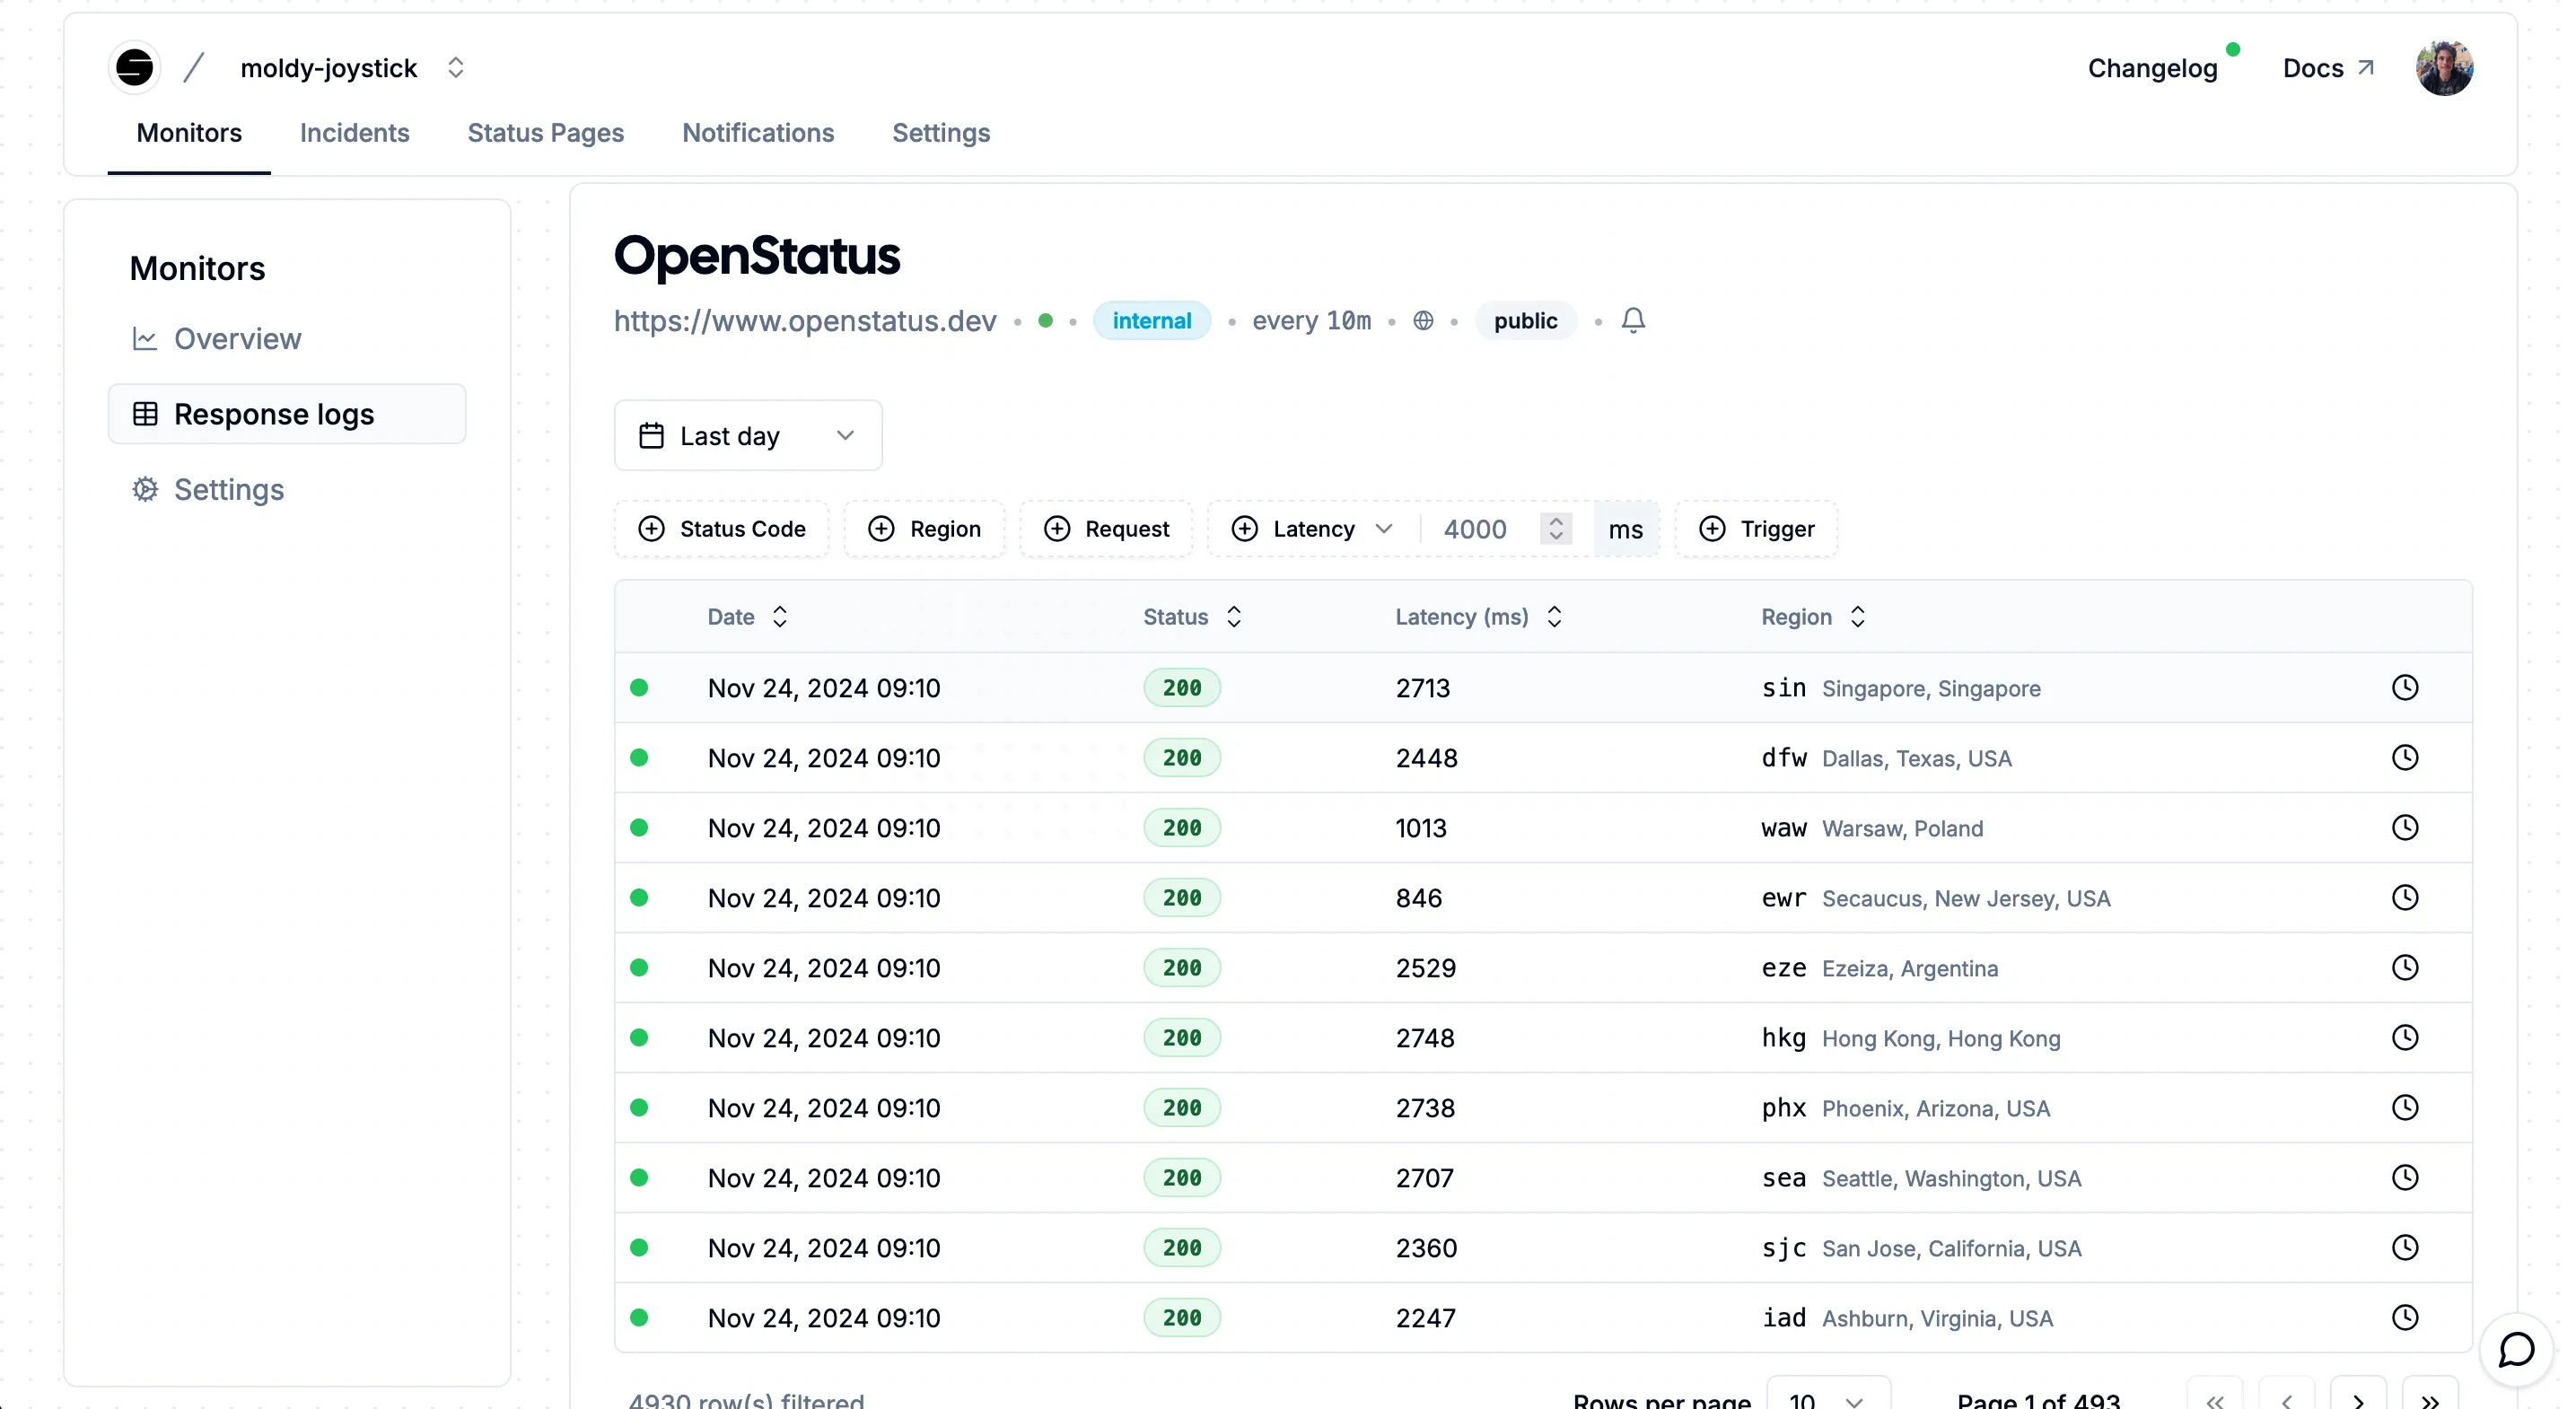
Section titled “Access Monitor Data Points”To view your monitor data points, navigate to the monitor details page and click on the Response tab.
Monitor Data Points
Section titled “Monitor Data Points”These are the data points that are collected by the monitor during the check.
HTTP Monitor Metrics
Section titled “HTTP Monitor Metrics”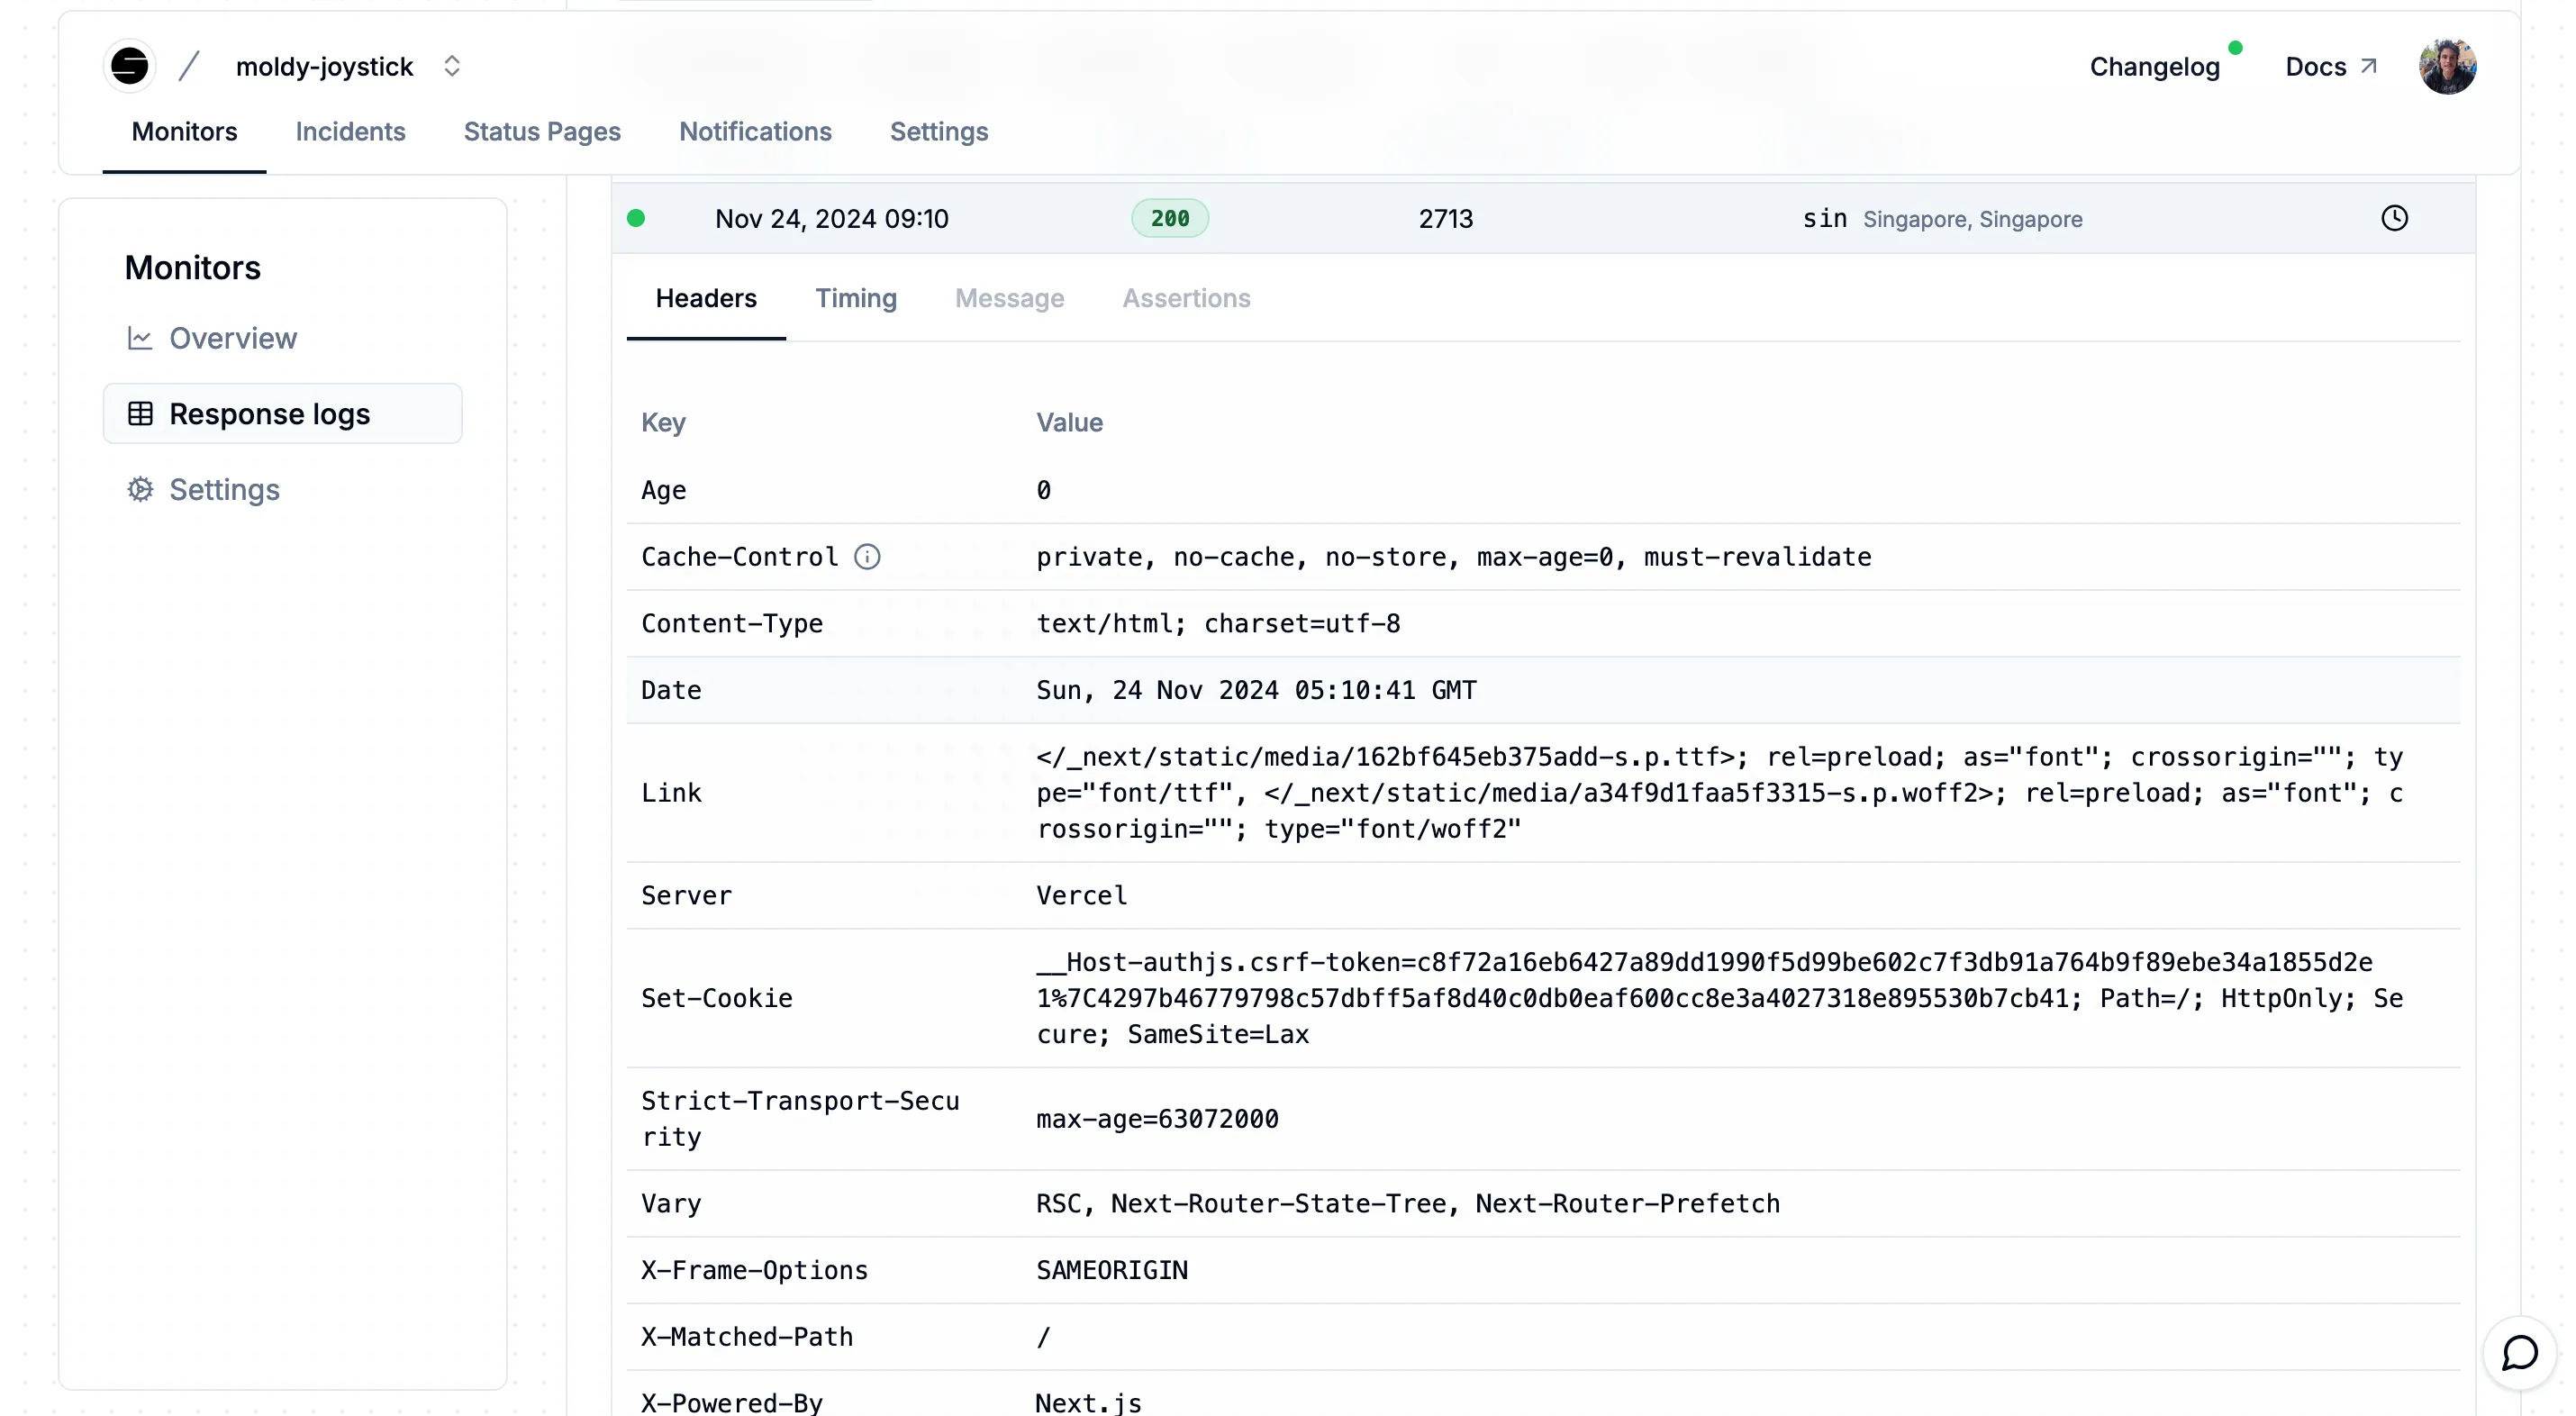
For an HTTP monitor, the following metrics are collected:
-
Status Code: The HTTP status code returned by the server.
-
Response Time: The time taken by the server to respond to the request.
-
Response Size: The size of the response body.
-
Response Headers: The headers returned by the server.
-
Response Body: The body of the response in case of error
-
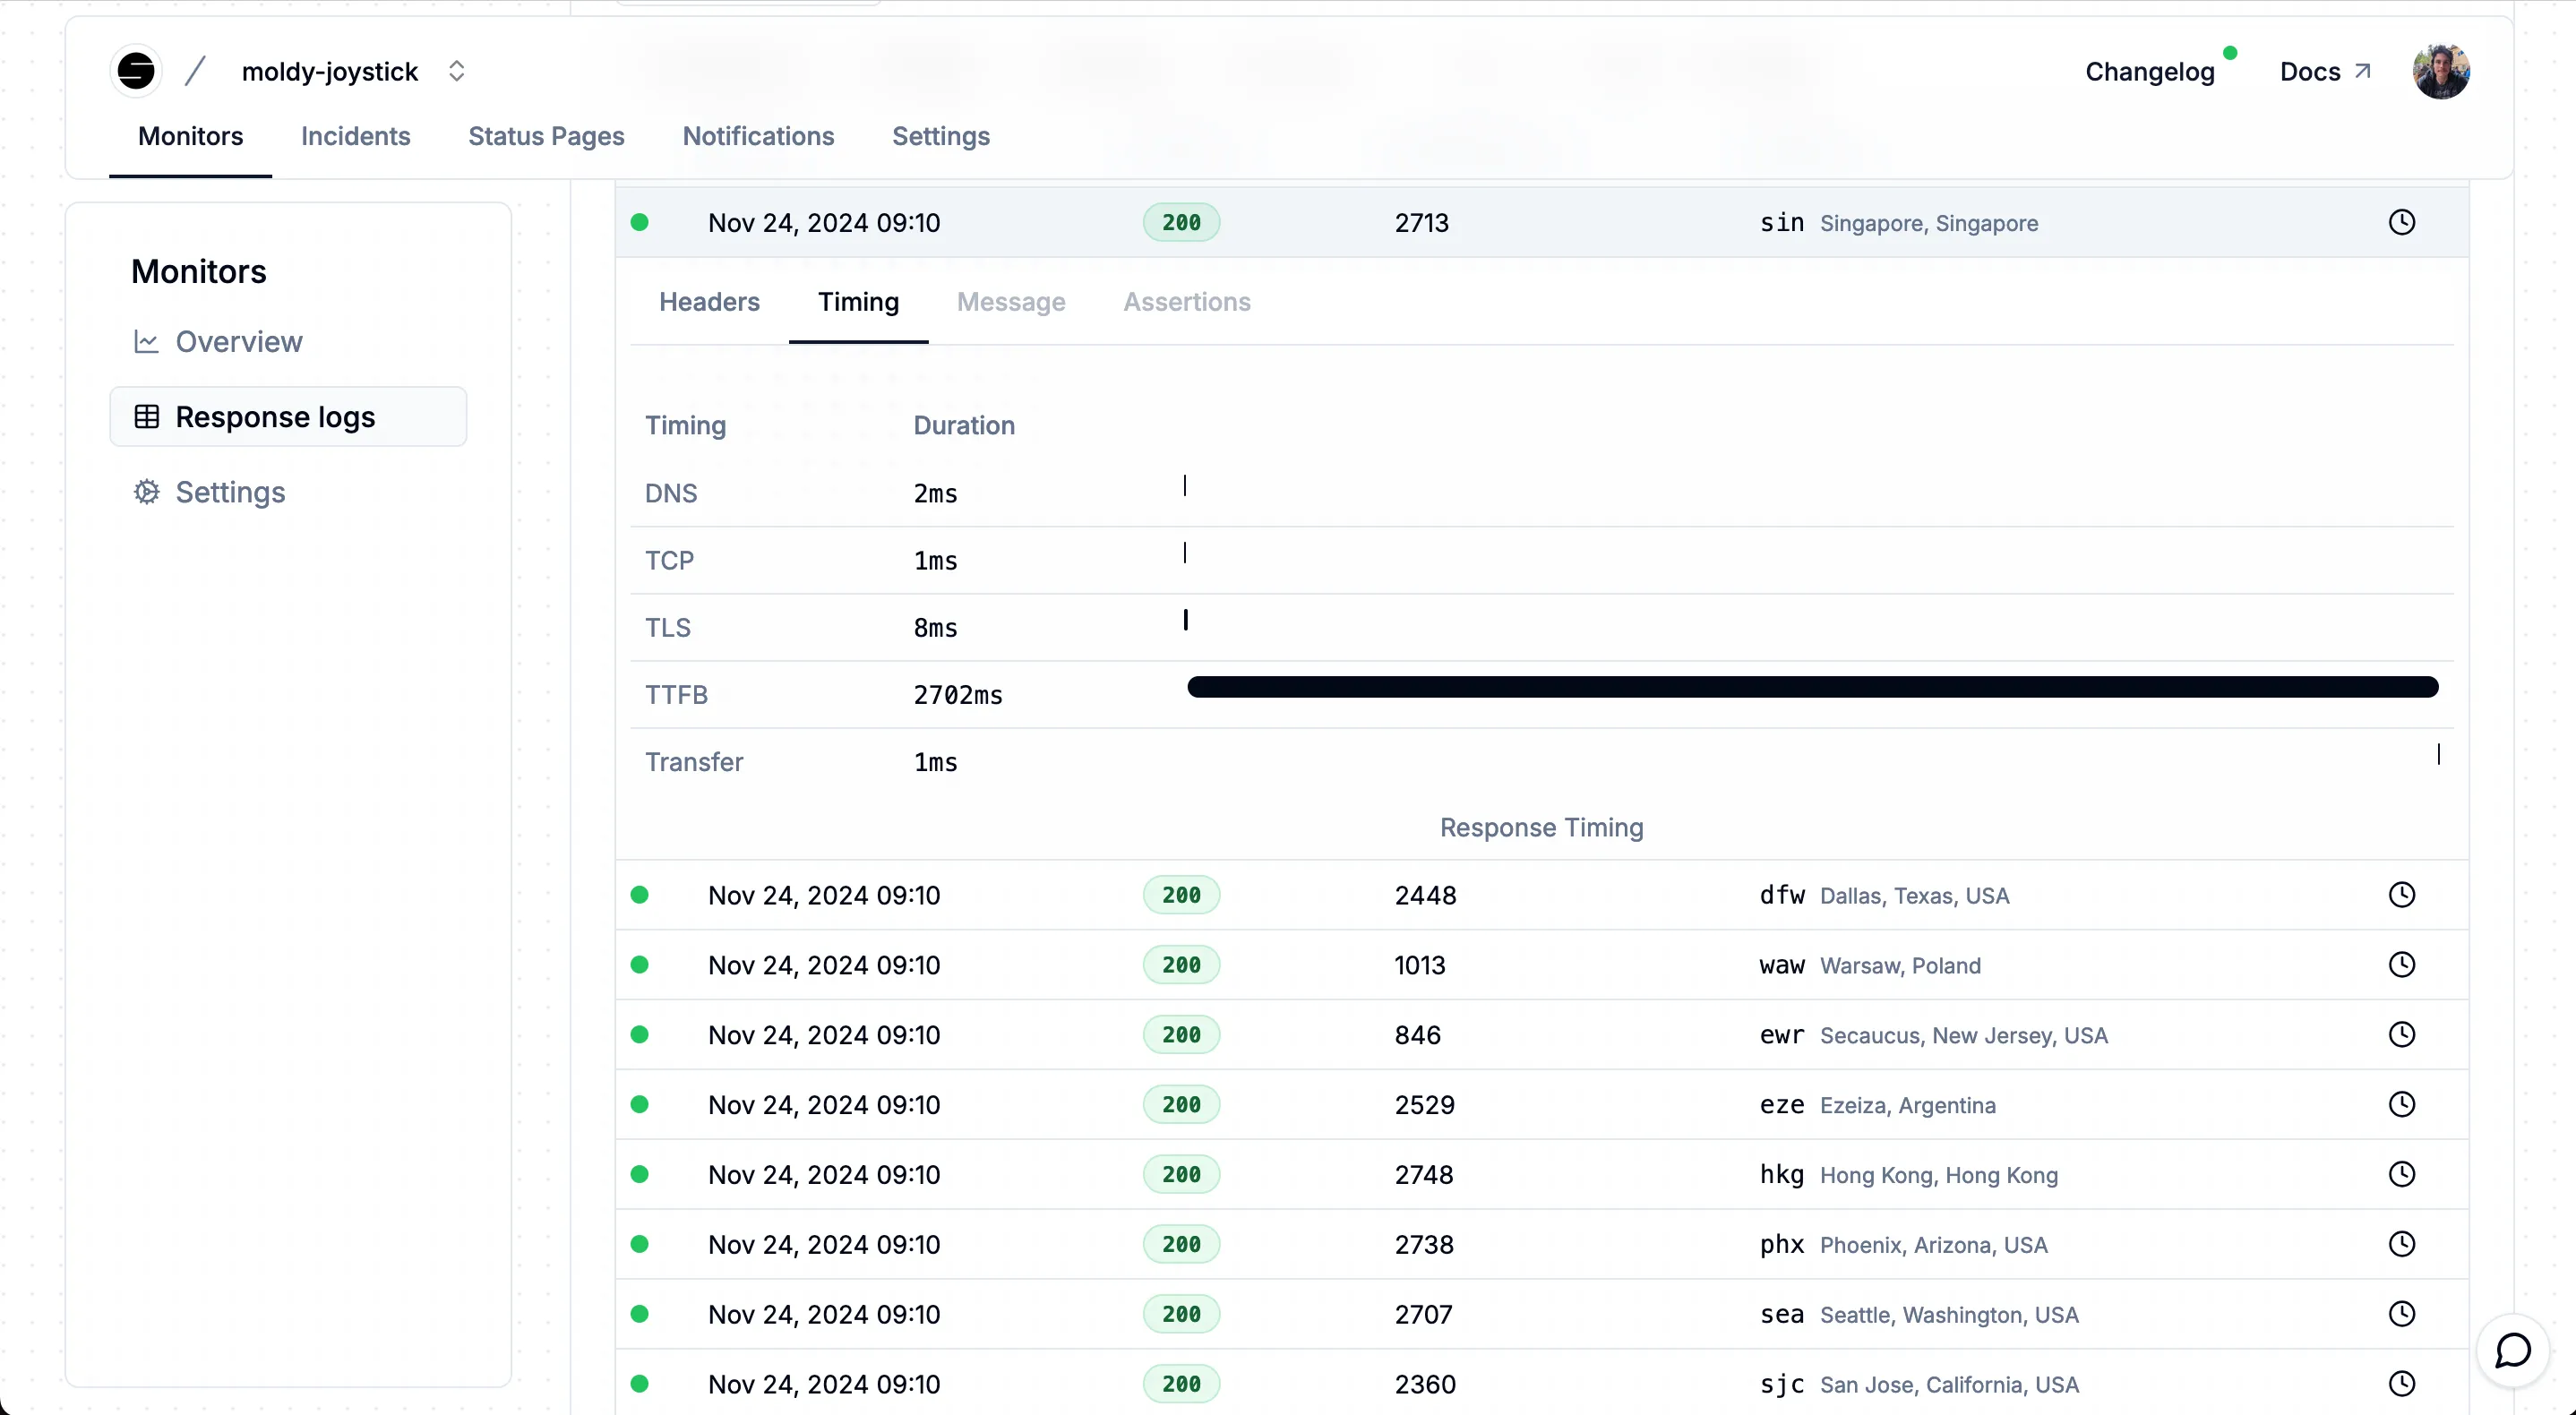
DNS timing: The time taken to resolve the domain name.
-
TCP timing: The time taken to establish a TCP connection.
-
TLS timing: The time taken to establish a TLS connection.
-
TTFB timing: Time to first byte, the time taken to receive the first byte of the response.
-
Transfer timing: The time taken to download the response body.
TCP Monitor Metrics
Section titled “TCP Monitor Metrics”For a TCP monitor, the following metrics are collected:
- Response Time: The time taken by the server to respond to the request.
- TCP timing: The time taken to establish a TCP connection.