Creating Your First Monitor
This guide will walk you through the process of creating your first monitor, your automated watchdog for your services. A monitor periodically checks your endpoints to ensure they are available, performant, and returning the correct data. Think of it as a curl command that runs 24/7, providing continuous insights into the health of your application.
Get Started in 1 Minute
Section titled “Get Started in 1 Minute”Let’s get your first uptime check up and running.
1. Create the Monitor
Section titled “1. Create the Monitor”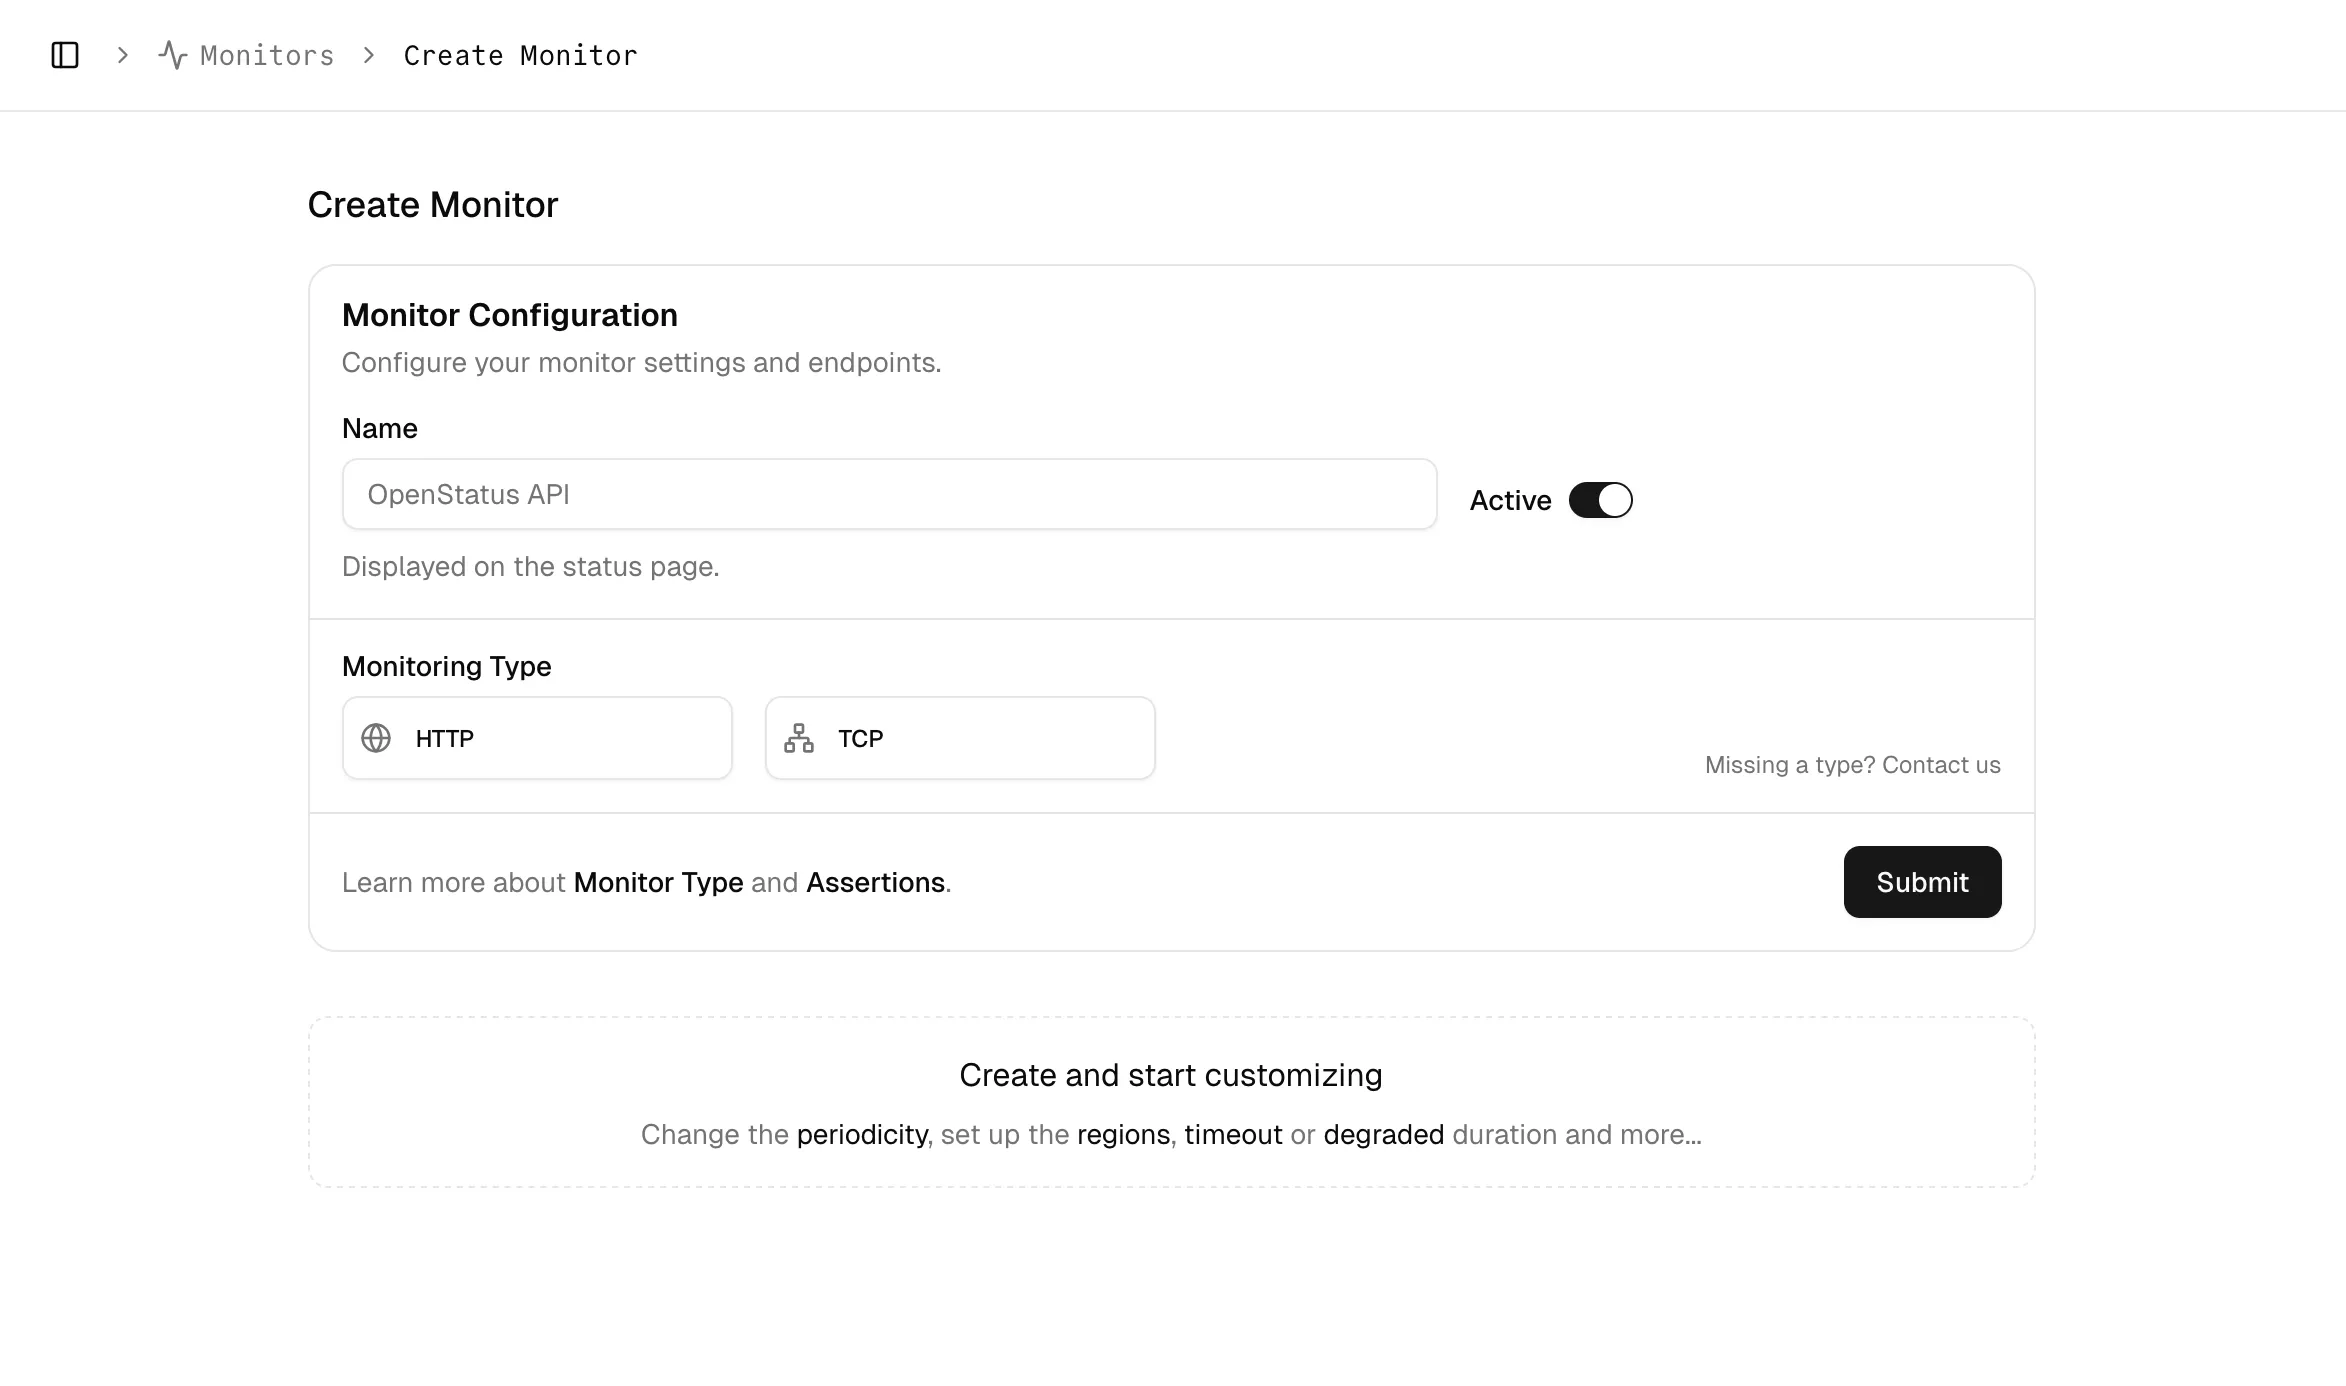
Navigate to the Monitors page from the sidebar and click the Create Monitor button. This will open a new configuration screen.
2. Configure the Basics
Section titled “2. Configure the Basics”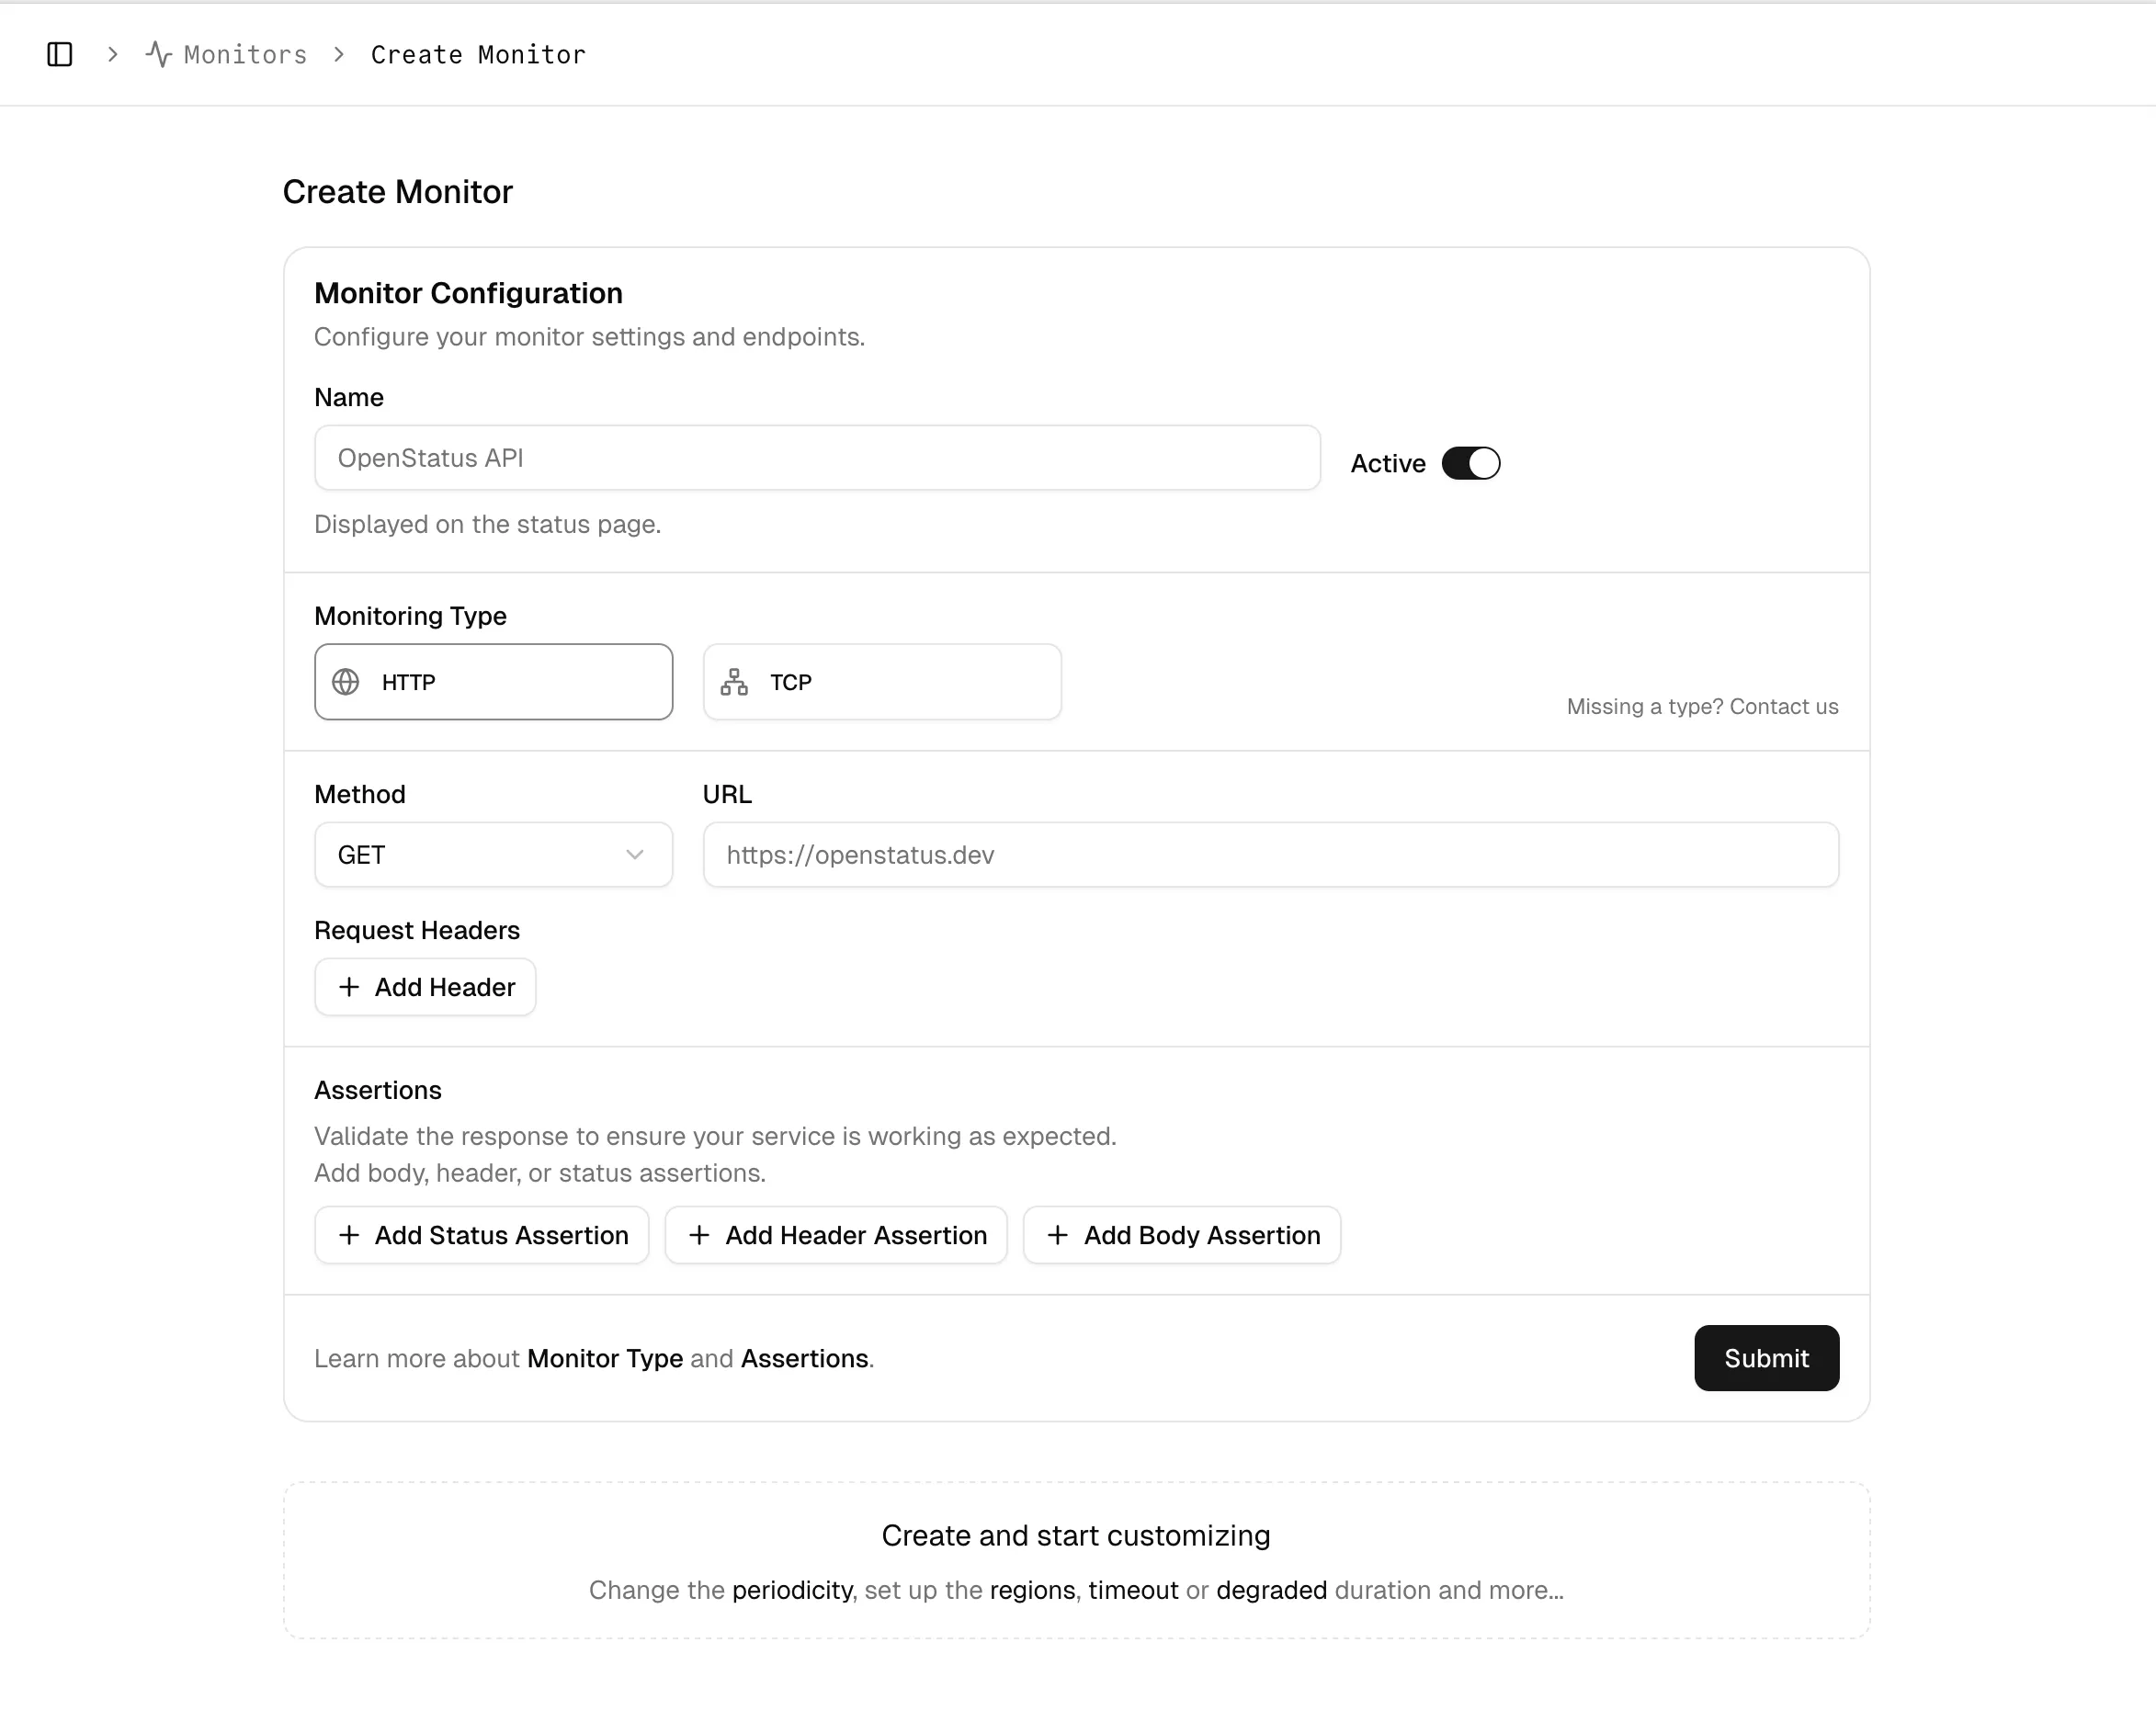
To get your monitor started, you only need to provide two essential pieces of information:
- Name: A clear, descriptive name for your monitor (e.g., “Production API Health Check” or “Homepage Uptime”).
- URL: The full URL of the endpoint you want to test (e.g.,
https://openstat.us).
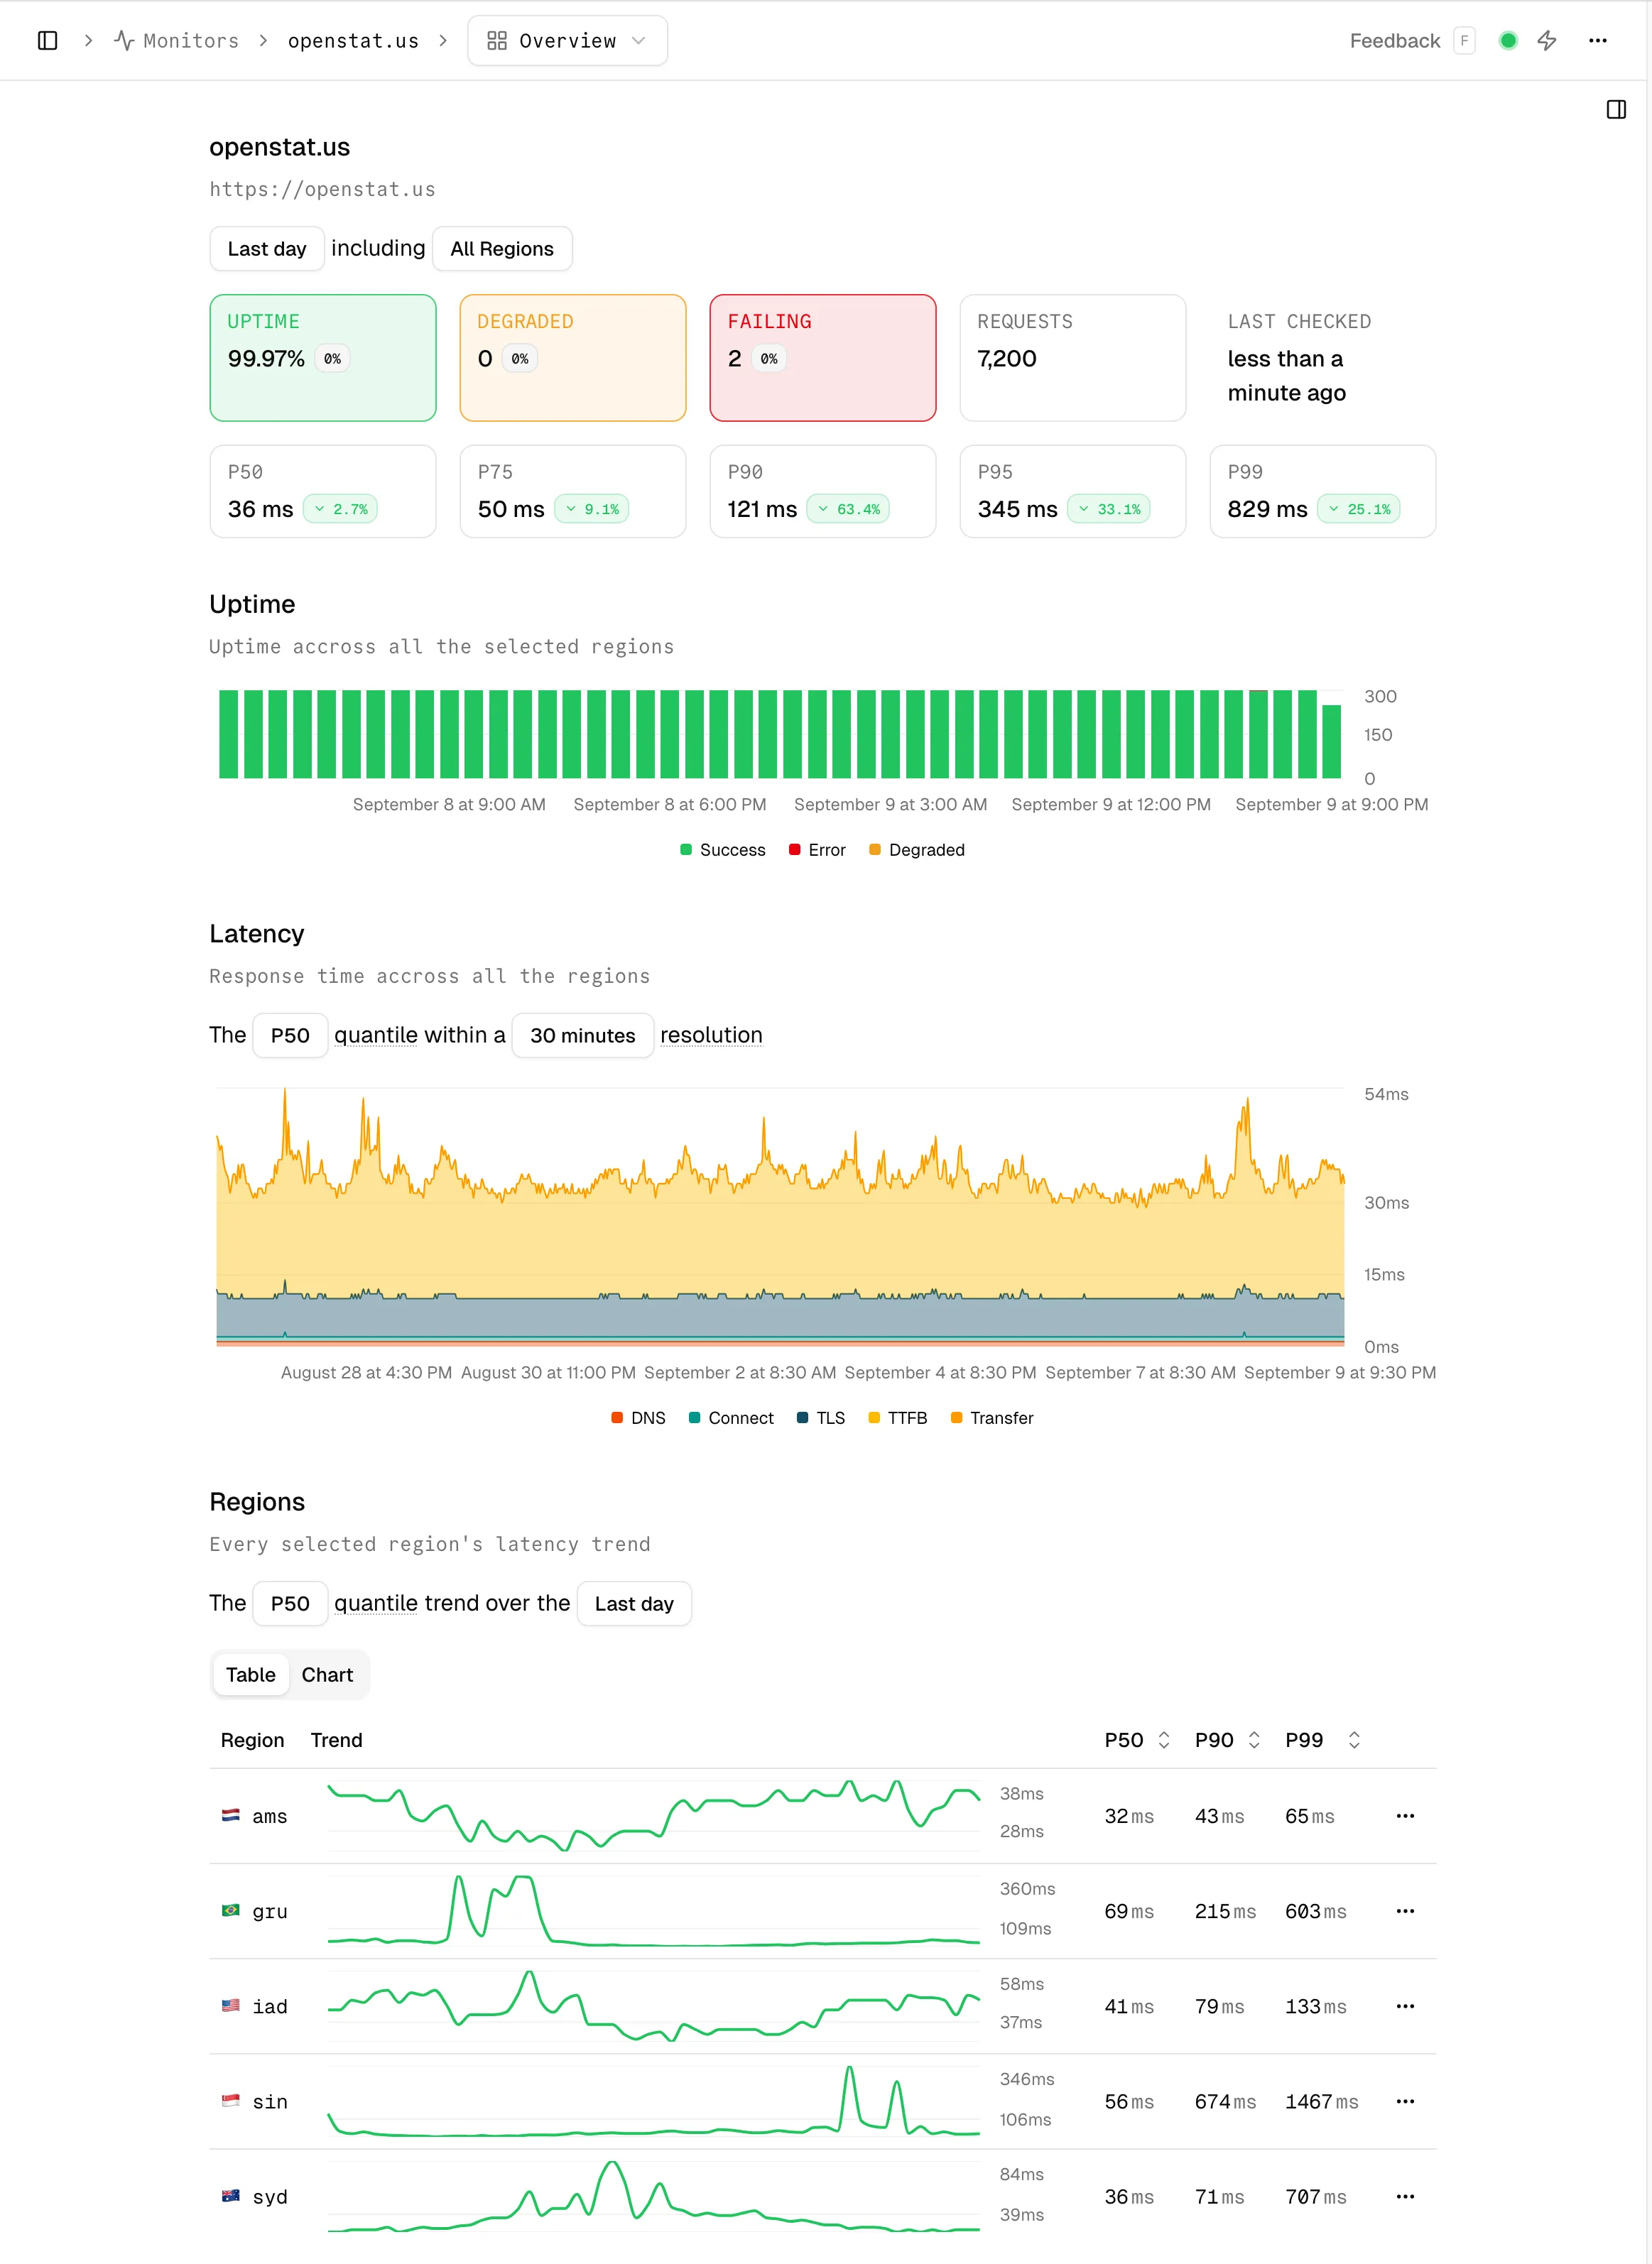
As soon as you enter the URL, our monitoring tool will automatically begin tracking key performance metrics for every check, including:
-
Response Time: The total time it takes for the request to complete.
-
Status Code: The HTTP status code returned by the server (e.g., 200, 404, 500).
-
Response Headers: A detailed view of the headers returned by the server.
-
Detailed Timing Metrics: A breakdown of the time spent on each phase of the request (DNS lookup, TCP connection, TLS handshake, etc.)
3. Customizing the HTTP Request
Section titled “3. Customizing the HTTP Request”Your monitor doesn’t just have to be a simple GET request. You can customize the HTTP request to simulate real-world traffic and test specific scenarios.
HTTP Method
Section titled “HTTP Method”Choose the appropriate HTTP method for your check. While GET is the default and most common for simple health checks, you can also select POST, HEAD, OPTIONS, PUT, PATCH, DELETE, TRACE. OPTIONS
GET: Retrieve data from an endpoint. The most common choice for health checks.POST: Send data to an endpoint, for example, to test a form submission or API creation endpoint.HEAD: Same asGET, but without the response body. Useful for quickly checking if a resource exists.OPTIONS: Retrieve the supported HTTP methods for a resource.PUT: Update an existing resource.PATCH: Partially update an existing resource.DELETE: Delete a resource.TRACE: Echo the request back to the client.
Request Body
Section titled “Request Body”If you select the POST method, you can add a Request Body to your monitor’s configuration. This is essential for testing API endpoints that require a JSON, form-encoded, or other data payload. Simply enter the data you want to send in the provided text area.
Custom Headers
Section titled “Custom Headers”You can add any number of custom HTTP headers to your request. This is particularly useful for:
-
Authentication:: Sending an Authorization token (e.g., a Bearer token) to test a protected endpoint.
-
Content Type:: Setting an
content-typeheader to specify a content type (e.g.,application/json). -
Content Negotiation: Setting an Accept header to request a specific content type from the server (e.g.,
application/json). -
Simulating Clients: Adding a User-Agent header to simulate traffic from a specific browser or device.
Heads Up: We’ve got your User-Agent covered! OpenStatus automatically includes the
"User-Agent": "OpenStatus/1.0"header in every request. This makes it easy to identify and filter out our monitoring traffic from your server logs or analytics.
Fine-Tuning Your Monitor ⚙️
Section titled “Fine-Tuning Your Monitor ⚙️”Once you’ve configured the basics, you can further refine your monitor’s behavior with these advanced options:
Important Considerations
Section titled “Important Considerations”Monitoring Third-Party Endpoints
Section titled “Monitoring Third-Party Endpoints”Video Tutorial
Section titled “Video Tutorial”Create your first monitor